Published payback figures for hybrid vessels range from under two months to over seven years. Both ends of that spread come from credible sources. The difference isn’t accuracy. It’s that payback depends almost entirely on how a vessel operates, and most models either ignore that or quietly assume best-case conditions. A tug that idles at berth and a ferry that cycles twelve times daily produce completely different answers from identical hardware.
This guide shows you how to build a number your finance team can defend.
What we’ll cover:
- Why published payback figures vary so widely and what that means for your model
- Building the baseline: what your current fuel and maintenance burn actually costs
- The full CapEx picture, including the costs most quotes leave out
- Calculating annual savings across fuel, maintenance, and compliance
- NEW: Residual value, battery replacement timing, and the second-life question
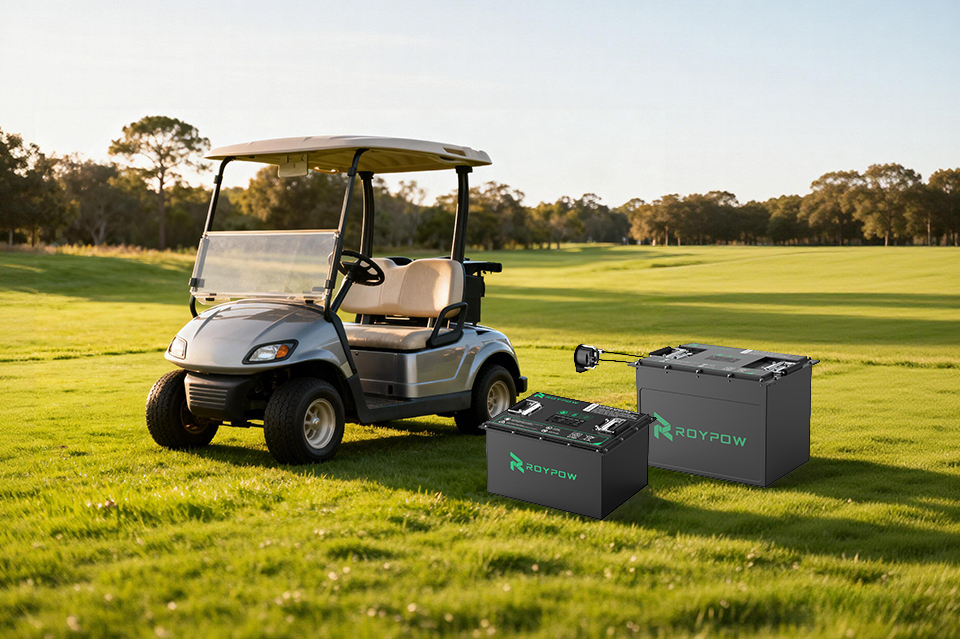
For a concrete reference point, ROYPOW’s marine battery platform is DNV type-approved, and their inland waterway research puts OPEX reduction near 45% with payback around 3.5 years.
Why Payback Figures Vary So Wildly
Search for hybrid vessel payback, and you’ll find claims spanning two orders of magnitude. Some studies cite payback periods as short as a few months for fully electric ferries and hybrid platform supply vessels. Others put realistic hybrid payback nearer five years.
Both can be true. Here’s why.
Payback Is a Function of Utilisation
The savings mechanism is fuel displacement. Displace more fuel, and you pay back faster. Simple.
What varies enormously is how much fuel a given vessel burns inefficiently in the first place.
|
Vessel Type |
Operating Pattern |
Payback Driver |
|
Harbour ferry |
12+ cycles daily, fixed route |
Very high fuel displacement, fast payback |
|
Escort tug |
Long idle, short high-power bursts |
Peak shaving eliminates heavy idling waste |
|
Offshore support vessel |
DP operation, variable load |
Generator optimisation during station-keeping |
|
Coastal cargo |
Long steady transit |
Lower displacement potential, slower payback |
|
Occasional-use workboat |
Few operating hours annually |
Long payback, weak business case |
A vessel operating 4,000 hours annually pays back roughly eight times faster than one operating 500 hours, assuming identical hardware. That single variable explains most of the spread in published figures.
What Published Figures Often Omit
When you see a headline payback number, check whether it includes:
- Installation and integration labour, not just equipment
- Vessel downtime during retrofit
- Class approval and documentation costs
- Shore charging infrastructure, where required
- Battery replacement within the analysis period
- Crew training and commissioning
A figure covering equipment cost alone will always look better than one covering delivered, operational capability.
Pro tip: When a supplier quotes payback, ask what denominator they used. “Payback against equipment cost” and “payback against total project cost” can differ by a factor of two on a retrofit.
For background on how hybrid architectures create savings in the first place, ROYPOW’s piece on diesel generator hybrid ESS explains the peak-shaving mechanism clearly.
Build the Baseline Before Anything Else
You cannot calculate savings without knowing precisely what you spend today. This step gets skipped constantly, and it’s where most weak business cases originate.
Fuel: Get Real Consumption, Not Rated Figures
Engine manufacturers publish specific fuel consumption at optimal load. Your vessel doesn’t operate there.
What you need:
- Actual annual fuel purchase, from invoices rather than estimates
- Consumption split by operating mode, if your monitoring supports it
- Engine load profile, showing how many hours sit below 50% load
- Idle and manoeuvring hours, where specific consumption is worst
That last figure matters disproportionately. Diesel engines running at 20-30% load burn fuel at dramatically worse specific consumption than at 75-85%. A vessel spending half its running hours in that band is carrying an enormous efficiency penalty, and that penalty is precisely what a battery removes.
Maintenance: Count the Full Picture
|
Cost Item |
What to Capture |
|
Scheduled servicing |
Annual cost across all engines |
|
Overhaul reserve |
Major overhaul cost divided by interval hours |
|
Lubricating oil |
Annual consumption and disposal |
|
Filters and consumables |
Annual spend |
|
Unscheduled repairs |
Three-year average, not last year only |
|
Labour |
Internal and contracted |
Engine maintenance scales with running hours, not calendar time. If a hybrid system cuts engine hours by 50%, most of this column halves too. That’s frequently a larger saving than operators expect going in.
Compliance and Emissions Costs
Increasingly relevant and increasingly expensive:
- Emissions Control Area (ECA) compliance and low-sulphur fuel premiums
- Port emissions charges and differentiated tariffs
- EU ETS maritime allowances, where applicable
- Regional low-emission zone restrictions affecting berth access
These costs trend upward. A model assuming today’s compliance cost for fifteen years is conservative in a way that understates the case for electrification.
Baseline Worked Example: Harbour Tug
|
Cost Category |
Annual |
|
Fuel (410,000 litres at $0.95/L) |
$389,500 |
|
Scheduled maintenance |
$62,000 |
|
Overhaul reserve |
$48,000 |
|
Lubricants and consumables |
$19,000 |
|
Emissions compliance |
$23,000 |
|
Total annual operating cost |
$541,500 |
This is the number every saving gets measured against.
The Full CapEx Picture
Equipment cost is the headline. It’s rarely more than 60% of the project.
What Goes Into the Capital Number
- Battery system. The cost most people quote. Price per kWh has fallen substantially over the past decade, which materially improves the case compared to projects analysed even five years ago.
- Power conversion and distribution. Inverters, DC switchboards, protection devices, and cabling. On retrofits, this can approach the battery cost itself.
- Integration engineering. Design, class submission, drawings, and approval. Substantially lower when the battery platform is already type approved, since class reviews the installation rather than the battery.
- Installation labour. Structural modification, compartment preparation, ventilation ducting, and cable routing.
- Vessel downtime. Often the largest hidden cost. A tug out of service for six weeks represents six weeks of lost charter revenue that belongs in the CapEx line.
- Shore infrastructure. Only applicable where shore charging is part of the concept, but potentially significant when it is.
- Training and commissioning. Crew familiarisation, sea trials, and handover documentation.
Where Certification Saves Real Money
This deserves specific attention because it’s underweighted in most models.
A battery system without existing type approval requires a full class assessment of the battery itself, adding months to the programme and significant cost. A DNV type-approved platform removes that scope entirely.
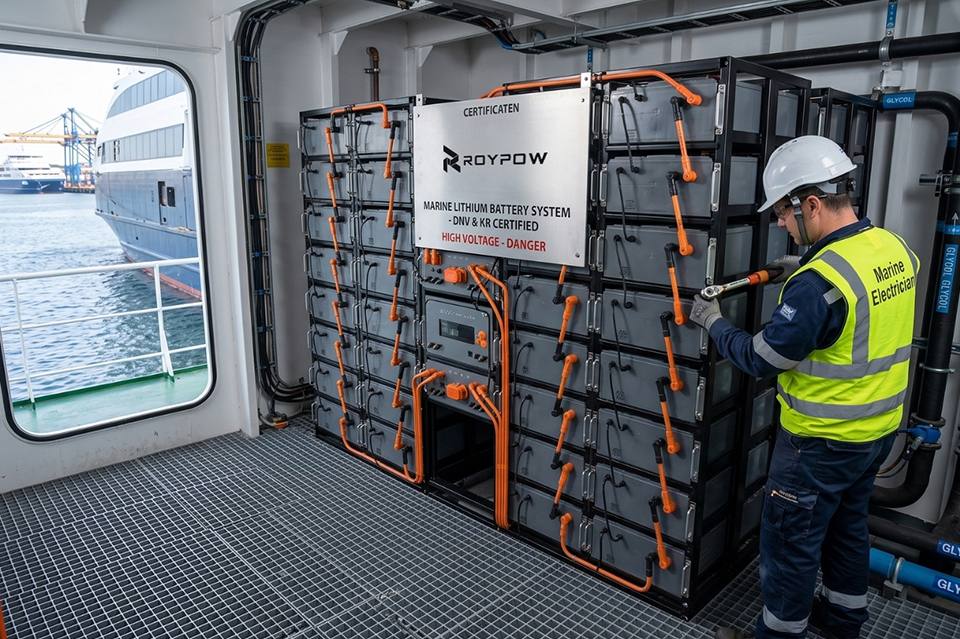
ROYPOW’s marine systems hold DNV Type Approval alongside UN 38.3 compliance, and existing DNV test records can typically be reused to accelerate ABS certification rather than repeating the full test programme. On a multi-vessel programme, that saving compounds across every hull.
Cooling Architecture Affects CapEx Too
Liquid-cooled systems add pumps, coolant lines, heat exchangers, leak detection, and additional hull penetrations. Each one is a capital cost, installation labour, and a maintenance line item for the asset’s life.
Naturally cooled systems remove that subsystem entirely. On a retrofit into a constrained compartment, the difference in installation complexity is substantial.
Pro tip: Build your CapEx number as a delivered-and-operational figure before calculating payback. A model built on equipment cost alone will produce an optimistic payback that falls apart during due diligence, which damages the whole business case rather than just the number.
Calculating Annual Savings
With a baseline established and CapEx defined, savings become arithmetic. The discipline is in being honest about each line.
Fuel Savings
This is the dominant line in almost every case.
Annual fuel saving = Baseline fuel cost × Displacement percentage − Electricity cost
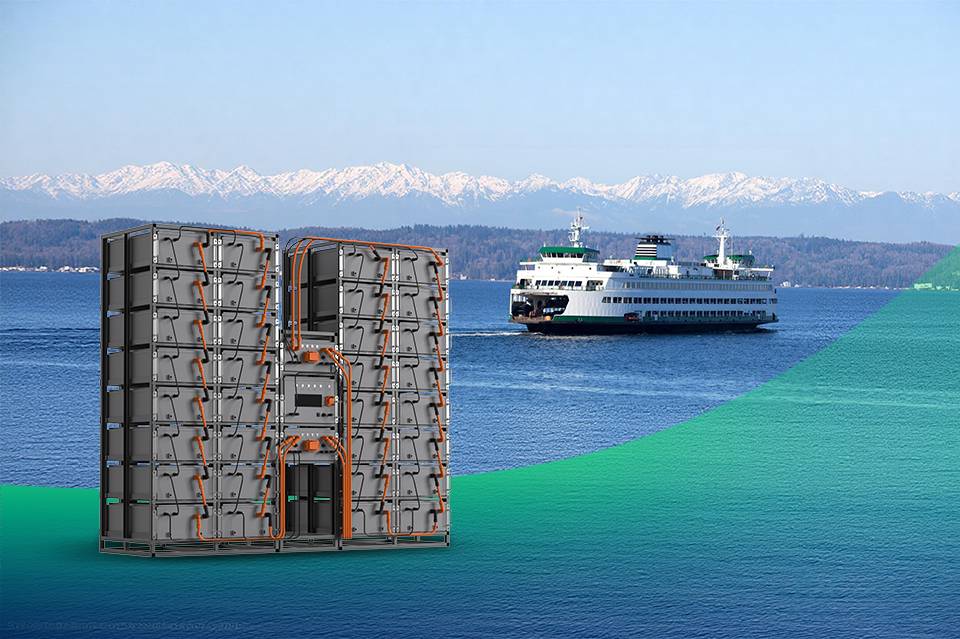
Displacement percentage depends on operating profile. Inland waterway research from ROYPOW indicates hybrid systems covering 35-70% of propulsion from battery power, depending on route and duty cycle.
Applying a mid-range 50% to our tug example:
- Baseline fuel: $389,500
- Fuel displaced: $194,750
- Electricity cost to replace it: roughly $52,000 (varies significantly by tariff)
- Net fuel saving: approximately $142,750
Note that electricity cost line. Models that omit it overstate savings by a meaningful margin.
Maintenance Savings
Engine maintenance tracks running hours. Cut hours by half, and most of the maintenance column follows.
|
Item |
Baseline |
Hybrid |
Saving |
|
Scheduled maintenance |
$62,000 |
$34,000 |
$28,000 |
|
Overhaul reserve |
$48,000 |
$26,000 |
$22,000 |
|
Lubricants |
$19,000 |
$10,000 |
$9,000 |
|
Battery maintenance |
$0 |
$3,000 |
-$3,000 |
|
Net maintenance saving |
|
|
$56,000 |
Lithium systems require essentially no routine maintenance. No watering, no topping up, no terminal servicing. The small figure above covers periodic inspection and BMS health review.
Compliance Savings
Reduced fuel burn cuts emissions proportionally, which reduces exposure to ECA premiums, port charges, and carbon pricing. Using 50% displacement on our $23,000 baseline: roughly $11,500 annually.
Total Annual Saving
|
Category |
Annual Saving |
|
Fuel (net of electricity) |
$142,750 |
|
Maintenance |
$56,000 |
|
Compliance |
$11,500 |
|
Total |
$210,250 |
Against a total project CapEx of, say, $720,000, simple payback lands at roughly 3.4 years — consistent with the 3.5-year figure ROYPOW’s inland waterway research reports.
Savings That Resist Quantification
Real, but harder to put a number on:
- Reduced noise and vibration, improving crew conditions and passenger experience
- Faster load response, improving manoeuvring precision and safety margin
- Redundancy, since the battery provides a second power source during generator failure
- Berth access, where low-emission zones restrict conventional vessels
- Charter competitiveness, as increasing numbers of charterers specify emissions performance
Leave these out of the headline calculation. Note them separately. A model that monetises soft benefits invites scepticism about the hard numbers too.
For a parallel analysis of how lifetime cost thinking applies in industrial applications, ROYPOW’s piece on why battery price is not the true cost uses the same TCO framework.
Residual Value and Replacement Timing
This is where most TCO models quietly fall apart, and it’s the section that separates a robust analysis from an optimistic one.
The Replacement Question
Batteries reach end of life at 80% of original capacity. Whether that falls inside your analysis period changes the answer substantially.
Work it in cycles, not years:
Annual cycles = Operating days × Cycles per day
- Harbour ferry: 340 days × 12 = 4,080 cycles annually
- Escort tug: 250 days × 1.5 = 375 cycles annually
- Coastal workboat: 180 days × 1 = 180 cycles annually
Against a 4,500-cycle rating:
|
Vessel |
Annual Cycles |
Years to End of Life |
|
Harbour ferry |
4,080 |
~1.1 years |
|
Escort tug |
375 |
~12 years |
|
Coastal workboat |
180 |
~25 years |
The ferry needs replacement budgeted repeatedly across a fifteen-year analysis. The workboat likely never replaces within the vessel’s life. Same battery, completely different TCO.
Cycle Depth Changes Everything
Cycle-life ratings are quoted at a specific depth of discharge. Reduce depth and cycle life rises sharply, often more than proportionally.
A system rated 4,500 cycles at 80% DoD may deliver 8,000 or more at 50% DoD.
For the ferry above, that’s the difference between replacing the battery roughly every year and replacing it every two. Oversizing the installation to cycle shallower frequently reduces lifetime cost despite higher upfront capital.
Run this calculation before finalising system size. It often changes the answer.
Falling Battery Prices Work in Your Favour
Lithium cell pricing has fallen substantially over the past decade and continues to trend downward. A replacement scheduled for year eight will almost certainly cost less per kWh than the original installation.
Modelling replacement at today’s prices is therefore conservative. State that assumption explicitly, because it strengthens rather than weakens your case under scrutiny.
Residual Value at Vessel Sale
Two components:
- Battery residual. A system at 85% capacity with documented health data carries real value. Undocumented condition carries almost none.
- Vessel premium. Hybrid vessels increasingly attract buyer interest as emissions regulation tightens. A conventional vessel faces the opposite pressure.
Keeping complete BMS health records across the asset’s life directly protects this value. It costs nothing, and it’s routinely neglected.
Second Life Is Real but Not Bankable
Marine batteries retired at 80% capacity retain substantial value for stationary storage applications where weight, volume, and C-rate matter far less.
The second-life market is developing but not yet mature enough to underwrite a residual assumption. Treat it as upside, not as a line in the model.
Pro tip: Present your TCO with and without battery replacement, and with and without residual value. A board that sees both bounds trusts the analysis. A board given one optimistic figure tends to assume you’ve built the case backwards from a conclusion.
For deeper background on the management layer protecting battery life, ROYPOW’s BMS fundamentals guide is a useful companion read.
Run the Numbers With ROYPOW
A defensible marine battery TCO comes from four honest inputs: what you burn today, what the delivered project actually costs, what you’ll displace annually, and when the battery needs replacing. Get those right and payback follows arithmetically. Get any of them wrong, and the model collapses under the first serious question.
Key takeaways from this guide:
- Published payback ranges vary because utilisation varies. A 4,000-hour vessel pays back roughly eight times faster than a 500-hour one
- Build the baseline from fuel invoices and three-year maintenance averages, not rated consumption figures
- CapEx means delivered and operational: equipment, integration, installation, downtime, and training
- Type approval removes battery assessment from class scope, cutting both cost and programme time
- Deduct electricity cost from fuel savings. Models that skip this overstate the case
- Engine maintenance tracks running hours, so halving hours halves most of that column
- Convert the operating profile into annual cycles before assuming a replacement year
- Cycling shallower can double cycle life, often reducing lifetime cost despite higher upfront capacity
- Keep documented BMS health records. Undocumented battery condition carries near-zero residual value
ROYPOW’s high-voltage marine battery system is DNV type approved, naturally cooled, and scales from 32.7 kWh to 2,785 kWh on a single module platform. Their Inland Waterway Electrification Economics 2026 research covers the 45% OPEX reduction and 3.5-year payback findings in full, and their team can model a configuration against your vessel’s actual duty cycle. Start at the contact page.
Frequently Asked Questions
How long is the payback on hybrid vessel electrification?
Typically three to five years for well-utilised commercial vessels. High-utilisation ferries and harbour craft pay back faster, while low-hour vessels take considerably longer.
What drives marine battery TCO the most?
Fuel displacement, which depends on operating profile. Vessels with heavy idling or frequent low-load running displace the most fuel and pay back fastest.
Should electricity cost be included in savings calculations?
Yes. Net fuel saving equals displaced diesel cost minus the electricity cost replacing it. Omitting electricity overstates annual savings significantly.
When does a marine battery need replacing?
At 80% of original capacity. Calculate annual cycle count against the rated cycle life at your actual depth of discharge to find the replacement year.
Does a bigger battery reduce total cost of ownership?
Often yes. A larger system cycled shallower can double cycle life, deferring replacement far enough to offset the higher upfront capital.
What does DNV certification save on a project?
It removes the battery from detailed class assessment, reducing approval cost and programme duration. Existing DNV test records can also accelerate ABS certification.